A Recipe for Online Demos of Network Algorithms with GraphWin
|
Networks are graphs whose edges (and sometimes nodes) are labeled with numbers, e.g., capacities or/and costs. Online demos of network algorithms should allow the user to edit the underlying graph as well as the numbers associated with the edges. |
|
|
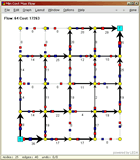
Edit and Run: A Simple Recipe for Interactive Demos and A Recipe for Online Demos of Graph Algorithms show different ways to react online to edit operations on the underlying graph. Here we show how to implement capacity changes by edge sliders. We use the min cost max flow algorithm as our example. The edit-and-run paradigm for demos of graph algorithms requires an explicit user action, namely clicking the done-button, to start the graph algorithm to be demonstrated. Call-back or handler functions allow us to write online demos which show the result of a graph algorithm while the graph is edited. On the right you see a screenshot of the program below. Clicking on the pictures shows the Graphwin in original size. |
 |
|
We globally define edge maps
We define a reference #include <LEDA/graphics/graphwin.h>
#include <LEDA/graph/graph_alg.h>
using namespace leda;
static edge_map<int> cap;
static edge_map<int> cost;
//run min cost flow and display result
void run_mcm_flow(GraphWin& gw)
{
bool flush=gw.set_flush(false);
graph& G=gw.get_graph();
node s=G.first_node();node t=G.last_node();
gw.message("\\bf Computing MinCostMaxFlow");
edge_array<int> flow(G);
int F=MIN_COST_MAX_FLOW(G,s,t,cap,cost,flow);
int C=0;
//sum up total cost and indicate flow[e] by the width of e
edge e; forall_edges(e,G) {
C+=flow[e]*cost[e];
gw.set_label_color(e,black);
gw.set_label(e,string("%d",flow[e]));
gw.set_width(e,1+int((flow[e]+4)/5));
if (flow[e]==0) gw.set_color(e,grey2);
//0-flow edges are faded to grey
else gw.set_color(e,black);
}
gw.set_flush(flush);
gw.message(string("\\bf Flow: %d \\bf Cost: %d",F,C));
gw.redraw();
}
For the edge handlers we first define an auxiliary function init_edge()
that sets the capacity and the cost of an edge to random values and
sets the slider values for the zeroth and the first slider of the
edge accordingly. The init_handler() initializes all
edges, computes a min cost max flow and displays it. The new_edge_handler()
initializes a new edge, computes a min cost flow and displays it.
//edge handlers
void init_edge(GraphWin& gw, edge e)
{
  //init capacity and cost to random value
  cap[e]=rand_int(1,50); cost[e]=rand_int(1,75);

  //set sliders accordingly
  gw.set_slider_value(e,cap[e]/100.0,0);  //slider zero
  gw.set_slider_value(e,cost[e]/100.0,1);  //slider one
}

void init_handler(GraphWin& gw)
{
  edge e;
  forall_edges(e,gw.get_graph()) init_edge(gw,e);
  run_mcm_flow(gw);
}

void new_edge_handler(GraphWin& gw, edge e)
{init_edge(gw,e);run_mcm_flow(gw);}
The cap_slider_handlers() handle the change of capacities.
We use the zeroth edge slider for the capacities. When an edge slider
is picked up we display an appropriate message. As long as the slider
is moved we display the new capacity. When the edge slider is released
we recompute the flow and display it. Cost sliders are treated in
the same way.
//capacity and cost sliders
void start_cap_slider_handler(GraphWin& gw, edge, double)
{gw.message("\\bf\\blue Change Edge Capacity");}

void cap_slider_handler(GraphWin& gw, edge e, double f)
{
  cap[e]=int(100*f);
  gw.set_label_color(e,blue);
  gw.set_label(e,string("cap = %d",cap[e]));
}

void end_cap_slider_handler(GraphWin& gw, edge, double)
{run_mcm_flow(gw);}

//cost sliders
void start_cost_slider_handler(GraphWin& gw, edge, double)
{gw.message("\\bf\\red Change Edge Cost");}

void cost_slider_handler(GraphWin& gw, edge e, double f)
{
  cost[e]=int(100*f);
  gw.set_label_color(e,red);
  gw.set_label(e,string("cost = %d",cost[e]));
}

void end_cost_slider_handler(GraphWin& gw, edge, double)
{run_mcm_flow(gw);}
In the main program we generate a (grid) graph G and
associate the edge maps cap and cost with
it. We define a GraphWin gw for G. We disable
edge bends since sliders can be used for straight line edges only.
We set the handlers for edge events and the handlers for slider events.
Then we set the node and
edge attributes and adjust the size of the layout such that it
uses about 90% of the GraphWin. Finally, we open the GraphWin and
put it into edit mode.
int main()
{
  //construct a (grid) graph
  graph G;
  node_array<double> xcoord;node_array<double> ycoord;
  grid_graph(G,xcoord,ycoord,5);

  //initialize cap and cost maps
  cap.init(G);
  cost.init(G);

  GraphWin gw(G,"Min Cost Max Flow");

  //disable edge bends
  gw.set_action(A_LEFT|A_DRAG|A_EDGE,NULL);

  //set handlers
  gw.set_init_graph_handler(init_handler);
  gw.set_del_edge_handler(run_mcm_flow);
  gw.set_del_node_handler(run_mcm_flow);
  gw.set_new_edge_handler(new_edge_handler);
  gw.set_start_edge_slider_handler(start_cap_slider_handler,0);
  gw.set_edge_slider_handler(cap_slider_handler,0);
  gw.set_end_edge_slider_handler(end_cap_slider_handler,0);
  gw.set_edge_slider_color(blue,0);
  gw.set_start_edge_slider_handler(start_cost_slider_handler,1);
  gw.set_edge_slider_handler(cost_slider_handler,1);
  gw.set_end_edge_slider_handler(end_cost_slider_handler,1);
  gw.set_edge_slider_color(red,1);

  //set attributes of nodes and edges
  gw.set_node_color(yellow);
  gw.set_node_shape(circle_node);
  gw.set_node_label_type(no_label);
  gw.set_node_width(14);gw.set_node_height(14);
  gw.set_edge_direction(directed_edge);

  node s=G.first_node();
  gw.set_shape(s,rectangle_node);
  gw.set_width(s,22);gw.set_height(s,22);
  gw.set_color(s,cyan);gw.set_label(s,"S");

  node t=G.last_node();
  gw.set_shape(t,rectangle_node);
  gw.set_width(t,22);gw.set_height(t,22);
  gw.set_color(t,cyan);gw.set_label(t,"T");

  //adjust layout
  gw.adjust_coords_to_win(xcoord,ycoord);
  gw.set_layout(xcoord,ycoord);

  //open gw
  gw.display();gw.zoom(0.9);gw.edit();
  gw.get_window().screenshot("gw_online_network_algs");

  return 0;
}
|
|
See also:
Edit and Run: A Simple Recipe for Interactive Demos
A Recipe for Online Demos of Graph Algorithms