Curve Reconstruction
The function discussed here is a direct application of Voronoi diagrams.
What is a Curve Reconstruction?We want to reconstruct a curve from a set of sample points . Let
The algorithm CRUST described below takes a list
S of points and returns a graph
|
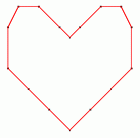
Result of CRUST for a set of (non-random) points. The picture is a screenshot from the program below. |
The Algorithm
The algorithm proceeds in three steps:- Construct the Voronoi diagram
VDof the points inS. - Construct a set
L=SUV, whereVconsists of all proper vertices ofVD. - Construct the Delaunay triangulation
DTofLand makeGthe graph of all edges inDTthat connect points inL.
The Implementation
void CRUST(const list<POINT> S,GRAPH<POINT,int> G)
{
  list<POINT> L=S;
  map<POINT,bool> voronoi_vertex(false);
  GRAPH<CIRCLE,POINT> VD;
  VORONOI(L,VD);

  node v; forall_nodes(v,VD) {
    //add Voronoi vertices and mark them
    if (VD.outdeg(v)<2) continue;
    POINT p=VD[v].center();
    voronoi_vertex[p]=true;
    L.append(p);
  }

  DELAUNAY_TRIANG(L,G);

  forall_nodes(v,G) if (voronoi_vertex[G[v]]) G.del_node(v);
}
Example Program for Curve Reconstruction
The following program uses CRUST to reconstruct the curve corrsponding
to the points in L and uses a window
to display the result.
#include <LEDA/core/list.h>
#include <LEDA/geo/point.h>
#include <LEDA/graphics/window.h>
#include <LEDA/geo/geo_alg.h>

using namespace leda;

int main()
{
  list<point> L;
  L.append(point(0,-30));   L.append(point(0,15));
  L.append(point(10,-20));  L.append(point(5,20));
  L.append(point(20,-10));  L.append(point(15,30));
  L.append(point(25,30));
  L.append(point(30,0));    L.append(point(30,20));
  L.append(point(-10,-20)); L.append(point(-5,20));
  L.append(point(-20,-10)); L.append(point(-15,30));
  L.append(point(-25,30));
  L.append(point(-30,0));   L.append(point(-30,20));

  GRAPH<point,int> G;
  CRUST(L,G);

  window W;
  W.init(-50,50,-50);
  W.open(); W.display();
  W.set_node_width(2);
  W.set_line_width(2);

  point p;
  forall(p,L) W.draw_filled_node(p.to_point());
  edge e;
  forall_edges(e,G) {
    point p=G[G.source(e)];
    point q=G[G.target(e)];
    W.draw_segment(p,q,red);
  }
  W.read_mouse();
  W.screenshot("crust");

  return 0;
}
See also:
Writing Kernel Independent Code
